3.10 Graphs are inaccessible for screen reader users (M)
3.10.1 WCAG 1.1.1 (A), 1.3.1 (A) - Desktop, Mobile, iPad
The graphs on the Risk page convey information about the risk of serious recidivism (RSR), OSP/C, and OSP/I to sighted users. However, this information is not accessible for screen reader users.
For instance, all the text-based elements (Medium, RSR, 4.12, 0%, 3% etc.) of the RSR graph are announced by screen readers. However, these are announced without any additional context; screen reader users are presented with a sequence of numbers and percentages without being informed what they are for.
Similarly, the context to the score of ‘Medium’ is not clear for the OSP/C and OSP/I scores. Not only is this information inaccessible for screen reader users, the current format of presenting these details could cause confusion and frustration.
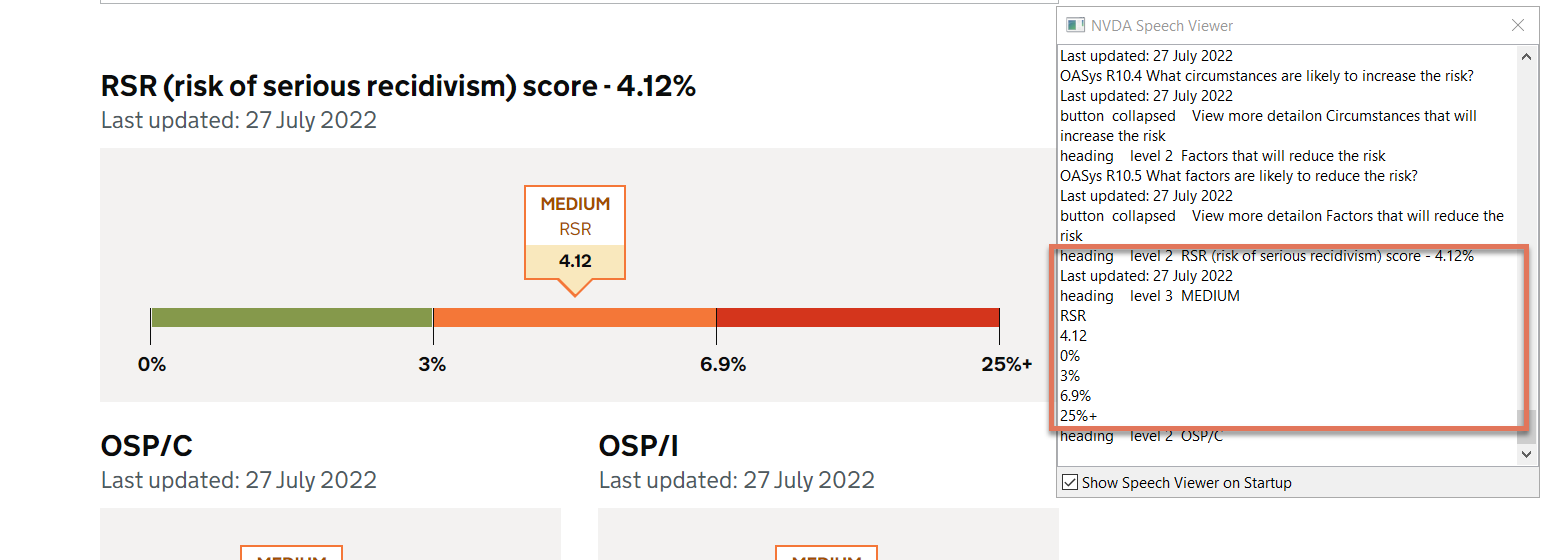
FIGURE 3.11: RSR graph on Risk page with NVDA speech viewer activated
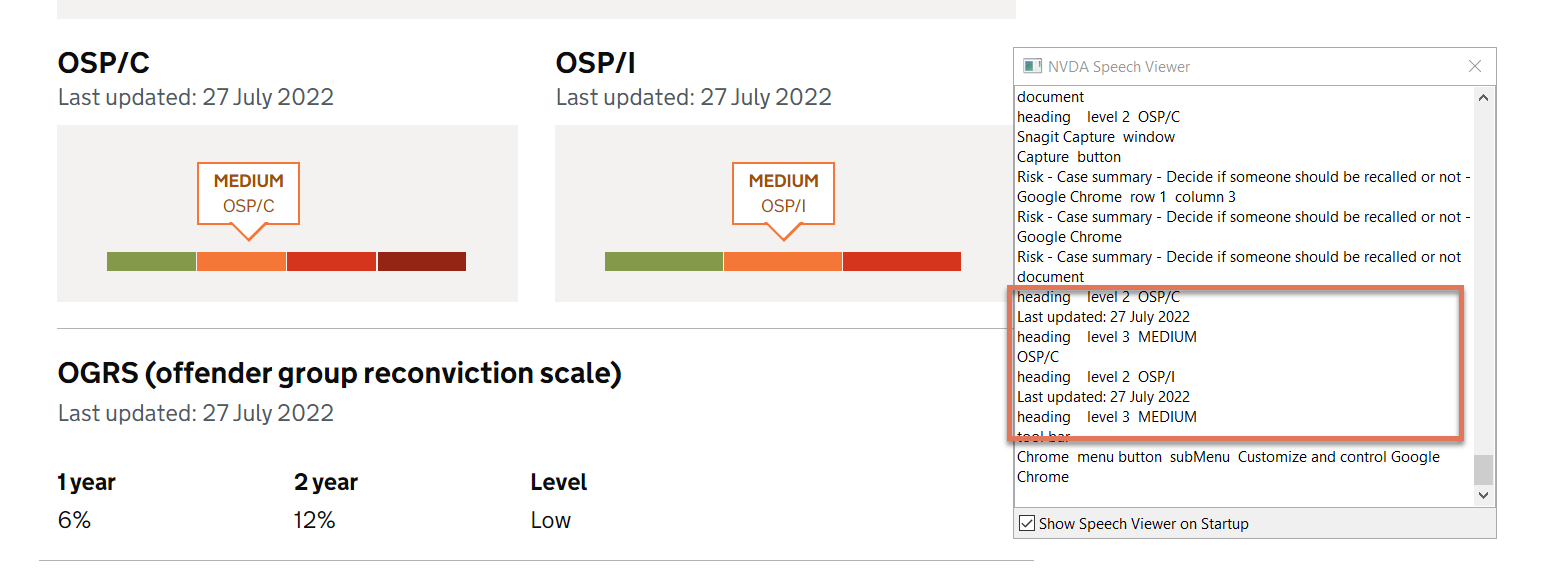
FIGURE 3.12: OSP graphs on Risk page with NVDA speech viewer activated
3.10.2 Code Snippet
<div class="score-label__card-top">
        <h3>MEDIUM</h3>
        <p>RSR</p>
</div>
<div class="score-label__card-bottom">
        <p>4.12</p>
</div>
3.10.3 Recommendation
We recommend providing an alternative description that captures the information presented in the graph. The current text-based elements can be hidden from screen readers aria-hidden="true". The description could be provided in a visually hidden span.
<div class="score-label__card-bottom" aria-hidden="true">
        <p>4.12</p>
</div>
<span class="visually-hidden">
        On a scale from 0% to 25%, the risk of serious recidivism is 4.12%.
        This falls within the medium range of 3% to 6.9%.
</span>